Jan 26, 2022
In November, year-over-year nominal house price appreciation reached 21.5 percent, the sixth consecutive month it has set a new record. According to our Real House Price Index (RHPI) - which measures housing affordability based on changes in income, interest rates and nominal house prices - affordability declined 21.0 percent compared with a year ago, as the growth in nominal house prices combined with the 30-basis point increase in the 30-year, fixed mortgage rate vastly outpaced the 4.4 percent increase in income. Affordability is likely to decline further in 2022, because both mortgage rates and nominal house prices are expected to rise.
“While home buyers may have FOMO because of rising rates, they may not want to succumb to the fear of better options, or ‘FOBO,’ because there may be a better home option or options when there’s more homes for sale, even if it means they may pay more.”
Fed Expected to Raise Rates Soon
The Federal Reserve has signaled the end of the easy money era is near. In order to combat inflation, the Fed is expected to increase rates as soon as March. Mortgage rates typically follow the same path as long-term bond yields, which are expected to increase due to the Fed’s tightening of monetary policy, higher inflation expectations and an improving economy. The consensus among economists is that the 30-year, fixed mortgage rate will increase from its November rate of 3.1 percent to 3.7 percent by the end of 2022. Some forecasters predict rates will reach 4 percent, which is still historically low, but well above what buyers have grown accustomed to in recent years.
Rising Mortgage Rates Likely to Reduce Affordability
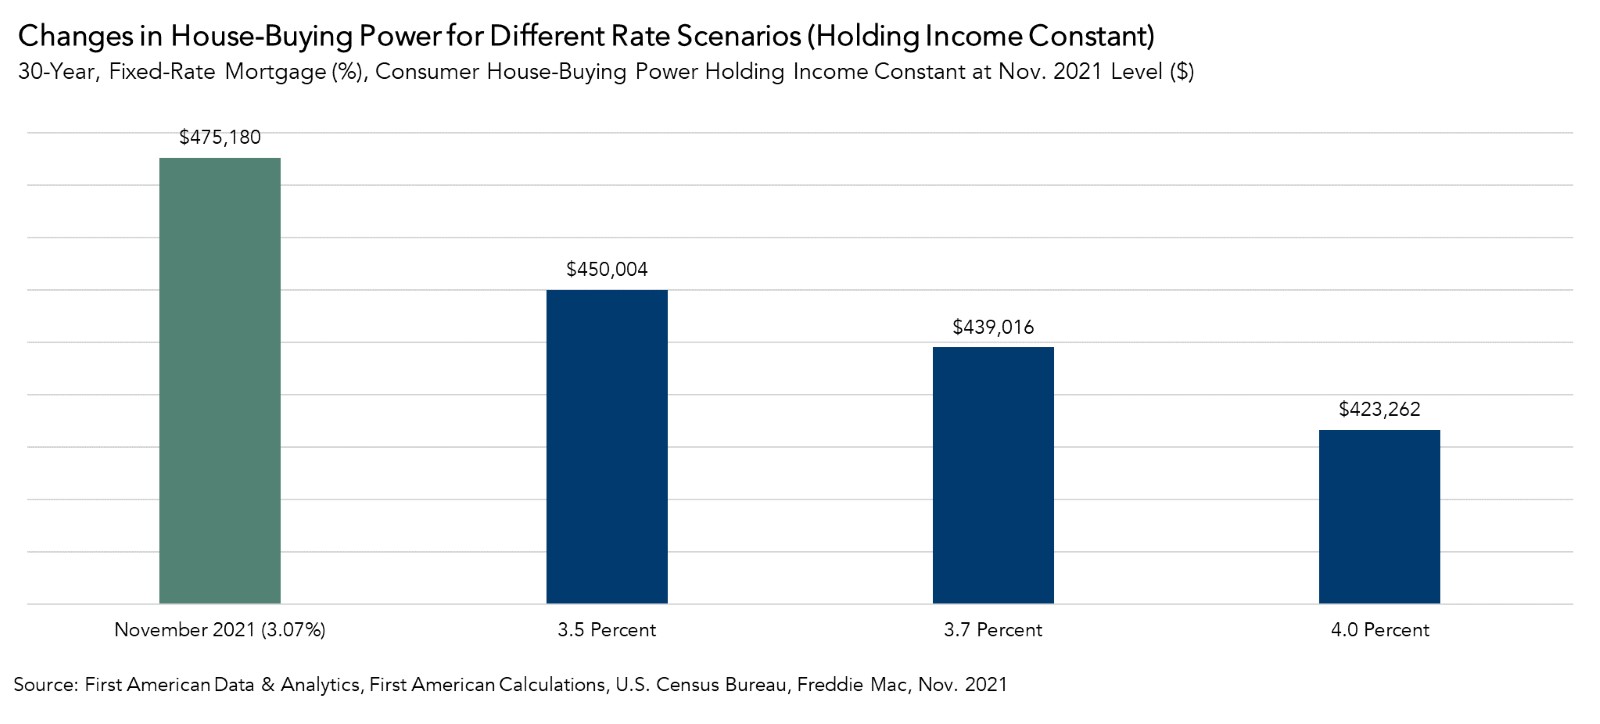
We can use the RHPI to model shifts in income and interest rates and see how they either increase or decrease consumer house-buying power and affordability. When mortgage rates increase, holding income constant, consumer house-buying power decreases.
If the average mortgage rate remained at its current level of approximately 3.5 percent through the spring home-buying season, assuming a 5 percent down payment and holding average household income constant at the November 2021 level of $69,800, house-buying power falls by approximately $25,000. If rates increase to the anticipated end of 2022 level of 3.7 percent, house-buying power would fall by $36,000. Finally, if mortgage rates reach 4 percent as some industry experts anticipate, house-buying power would fall by nearly $52,000 compared with November 2021.
Rising mortgage rates impact affordability, but one of the root causes of rising mortgage rates is an improving economy, and an improving economy often leads to stronger wage growth. Rising household income can blunt the negative impact that higher rates have on house-buying power. In fact, our estimate of average household income increased approximately 0.6 percent on a monthly basis in November 2021. If incomes continue to increase at this rate through the end of 2022, the income growth would reduce the projected end-of-year 2022 decrease in house-buying power to just $700, instead of $36,000.
FOMO (Fear of Missing Out) or FOBO (Fear of Better Options)?
While rates are expected to increase steadily throughout 2022, many potential home buyers may try to jump into the market now before rates rise further. The fear of missing out, or “FOMO,” on low rates and the potential loss of house-buying power may supercharge the housing market ahead of the spring home-buying season. However, housing supply tends to increase in the spring months as more sellers list their homes for sale. While home buyers may have FOMO because of rising rates, they may not want to succumb to the fear of better options, or “FOBO,” because there may be a better home option or options when there’s more homes for sale, even if it means they may pay more.
For more analysis of affordability, please visit the Real House Price Index. The RHPI is updated monthly with new data. Look for the next edition of the RHPI the week of February 21, 2022.
To view the original blog post by First American, please click here.
Sources:
November 2021 Real House Price Index Highlights
The First American Real House Price Index (RHPI) showed that in November 2021:
- Real house prices increased 1.5 percent between October 2021 and November 2021.
- Real house prices increased 21.0 percent between November 2020 and November 2021.
- Consumer house-buying power, how much one can buy based on changes in income and interest rates, increased 0.6 percent between October 2021 and November 2021, and increased 0.4 percent year over year.
- Median household income has increased 4.4 percent since November 2020 and 68.0 percent since January 2000.
- Real house prices are 5.6 percent less expensive than in January 2000.
- While unadjusted house prices are now 42.7 percent above the housing boom peak in 2006, real, house-buying power-adjusted house prices remain 33.8 percent below their 2006 housing boom peak.
November 2021 Real House Price State Highlights
- The five states with the greatest year-over-year increase in the RHPI are: Arizona (+33.1 percent), South Carolina (+28.1 percent), Florida (+28.0), Georgia (+27.4 percent), and Connecticut (+26.2),
- There were no states with a year-over-year decrease in the RHPI.
November 2021 Real House Price Local Market Highlights
- Among the Core Based Statistical Areas (CBSAs) tracked by First American, the five markets with the greatest year-over-year increase in the RHPI are: Phoenix (+34.6 percent), Charlotte, N.C. (+34.0), Tampa, Fla. (+32.0 percent), Atlanta (+30.0 percent) and Jacksonville, Fla. (+29.6 percent).
- Among the Core Based Statistical Areas (CBSAs) tracked by First American, there were no markets with a year-over-year decrease in the RHPI.
About the First American Real House Price Index
The traditional perspective on house prices is fixated on the actual prices and the changes in those prices, which overlooks what matters to potential buyers - their purchasing power, or how much they can afford to buy. First American’s proprietary Real House Price Index (RHPI) adjusts prices for purchasing power by considering how income levels and interest rates influence the amount one can borrow.
The RHPI uses a weighted repeat-sales house price index that measures the price movements of single-family residential properties by time and across geographies, adjusted for the influence of income and interest rate changes on consumer house-buying power. The index is set to equal 100 in January 2000. Changing incomes and interest rates either increase or decrease consumer house-buying power. When incomes rise and mortgage rates fall, consumer house-buying power increases, acting as a deflator of increases in the house price level. For example, if the house price index increases by three percent, but the combination of rising incomes and falling mortgage rates increase consumer buying power over the same period by two percent, then the Real House Price index only increases by 1 percent. The Real House Price Index reflects changes in house prices, but also accounts for changes in consumer house-buying power.
Disclaimer
Opinions, estimates, forecasts and other views contained in this page are those of First American’s Chief Economist, do not necessarily represent the views of First American or its management, should not be construed as indicating First American’s business prospects or expected results, and are subject to change without notice. Although the First American Economics team attempts to provide reliable, useful information, it does not guarantee that the information is accurate, current or suitable for any particular purpose. © 2022 by First American. Information from this page may be used with proper attribution.
Category / Topics
The preceding is for informational purposes only and is not and may not be construed as legal advice. No third-party entity may rely upon anything contained herein when making legal and/or other determinations regarding its practices, and such third party should consult with an attorney prior to embarking upon any specific course of action.